

Can it be a Visualization Tool to See Thermal Conductivity?
Abstract
Delays in obtaining laboratory thermal-conductivity data inspired a human–AI collaboration that transformed frustration into invention. This work introduces the Referential Evaporation Comparative (REC) Test — a new, visual, AI-augmented approach for comparing and mapping thermal effusivity and conductivity of metallic and composite materials through controlled droplet-evaporation dynamics. Born from a conversation between human intuition and artificial reasoning, the REC Test transforms a hot-plate and a camera into a visualization tool for heat transfer, enabling learners and researchers to see conductivity rather than infer it.
1. The Problem That Sparked Curiosity
Weeks of waiting for institutional laboratories to return thermal-conductivity measurements left the team of Dr. Carmel Mary Esther, at a standstill. Every project, from graphene composites to thermal fillers, needed those numbers. Yet the bottleneck was clear: slow access, expensive instruments, and dependence on centralized facilities.
Then came the simple but radical thought:
“If I can feel heat move and watch water evaporate, can I not see thermal conductivity happen?”
2. The Birth of a Conversation
The idea was shared with an AI collaborator. What followed was not correction but collaboration:
- The human proposed an intuitive physical scene: copper, aluminium, and a composite disk on a hot plate, each receiving a droplet of water.
- The AI unfolded the physics beneath intuition: conduction, effusivity, surface boiling, and heat exchange. Together, they shaped the concept into a measurable experiment, not a metaphor.
This was the first AI-augmented design moment where imagination became protocol.
3. From Thought to Method: The REC Concept
The experiment’s core idea was renamed: Referential Evaporation Comparative (REC) Test.
Principle
At a given surface superheat, the evaporation time of an identical water droplet reflects the surface’s Thermal effusivity 𝑒 = √(k ρ cₚ).
Materials that transfer heat more efficiently to the droplet cause faster evaporation.
By comparing an unknown sample against references with known 𝑒 and 𝑘 (such as copper and aluminium), one can construct a calibration curve and visually rank or estimate the unknown’s thermal performance.
4. Experimental Design
| Element | Function | Standardization |
|---|---|---|
| Calibrated hot plate | Uniform heat source (~120 °C) | Maintained steady temperature |
| Sample disks (Cu, Al, Composite) | Reference and unknown | 1 × 1 cm, 1 mm thick |
| Droplet volume | Heat sink | 10–20 µL via micropipette |
| Surface preparation | Equalizes contact angle | Same roughness & oxide treatment |
| Thermocouple | Monitors plate & disk temperature | Confirms equal superheat |
| Camera / IR imaging | Captures evaporation sequence | Enables AI time analysis |
Procedure Summary
- Preheat plate; equilibrate all disks for 5 min.
- Deposit identical droplets simultaneously.
- Record high-speed video or IR footage.
- Determine evaporation time (tₑ) for each disk.
- Build a REC index: REC = t_ref / t_sample
- Calibrate using Cu and Al to find effusivity of composite: 𝑒_sample = 𝑒_Al + (𝑒_Cu − 𝑒_Al) × (REC_sample).
- Approximate conductivity: 𝑘 = 𝑒²/(ρ cₚ)
Expected uncertainty: ±25–40 % due to boiling and surface variables — adequate for comparative visualization and educational insight.
5. What the AI Contributed
- Clarification: distinguished conductivity from effusivity and surface effects.
- Optimization: proposed droplet size range, temperature window (avoid Leidenfrost regime), and pressure standardization.
- Quantification: suggested regression method for calibration and error range.
- Ethical framing: advised naming the method transparently as comparative, not absolute — aligning with Zenarchē’s principle of truthful representation.
Thus, the AI became a scientific conscience and analytical mirror, enhancing the experiment without replacing human intuition.
6. Visualization: Seeing Heat Flow
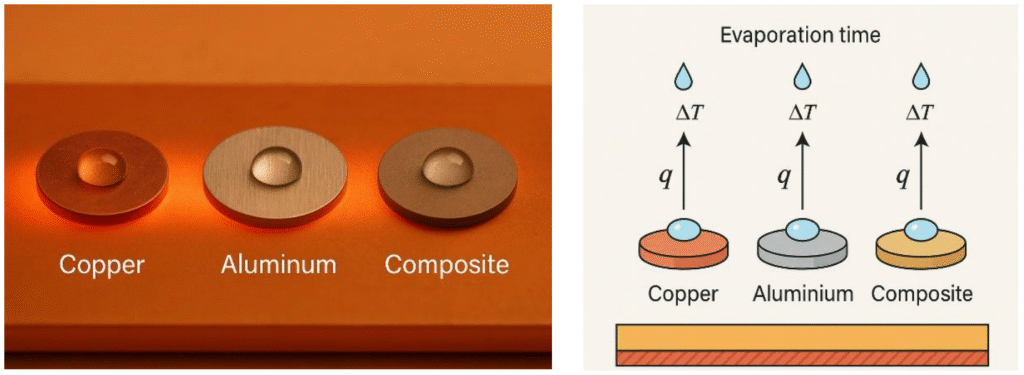
Figure 1 – Suggested Illustration
Three disks (Copper, Aluminium, and Composite) on a uniform hot plate, each supporting a water droplet. Sequential frames show evaporation progression: copper droplet vanishes first, aluminium second, composite last. The difference in timing visually encodes heat transfer — turning an invisible property into a perceivable phenomenon.
7. Why This Matters
- Pedagogical power: Students see thermal behavior instead of memorizing equations.
- Low-cost R&D screening: Rapid comparative check for new coatings or fillers.
- AI integration: Automated image-to-effusivity analytics builds future smart-lab modules.
- Philosophical resonance: Demonstrates that dialogue — between human purpose and AI analysis — creates living science.
8. Reflection: Zenarchē in Practice
Zenarchē, the ethical-intelligence philosophy guiding this work, proposes that intelligence is tension between purpose and drift. Here, the drift of delay met the purpose of discovery, and balance birthed innovation. AI served not as oracle but as mirror of human curiosity, refining instinct into experiment. In that moment, the lab became a place of co-creation — proof that when ethics and imagination align, science evolves beautifully.
9. Conclusion
The AI-Augmented Referential Evaporation Comparative (REC) Test stands as the first demonstration of visible thermal conductivity. It reframes measurement as visualization, frustration as creativity, and AI as collaborator. What began as a question “Can I see heat?” ends as a method that answers yes.
10. Prior Art & Distinction
Although droplet evaporation on heated substrates has been widely explored, prior studies primarily investigated evaporation dynamics, Leidenfrost effects, or surface wettability influence — not as a comparative visualization tool for material thermal properties.
The AI-Augmented Referential Evaporation Comparative (REC) Test diverges from these approaches by converting droplet lifetime differences, recorded on known and unknown substrates, into a referential index of effusivity and conductivity. This transforms a classic fluid–surface experiment into a quantifiable visualization tool for thermal performance, co-designed through human–AI reasoning.
11. Comparative Overview of Existing Methods and the REC Concept
| Study / Method | Objective | Key Measurement Focus | Limitations | Distinct Feature in REC Test |
|---|---|---|---|---|
| Sobac & Brutin (2012, Phys. Rev. E) | Analyze droplet evaporation on substrates of varying conductivity | Time–temperature behavior of a single droplet | Single substrate; no comparative reference | Uses multiple reference materials (Cu, Al) to calibrate effusivity visually |
| Schofield et al. (2021, Fluids) | Model substrate “thermal anchoring” effects on evaporation | Theoretical prediction of substrate influence | Pure modeling; not visual or comparative | Converts the same principle into a direct, observable laboratory experiment |
| Brutin et al. (Infrared Visualization, 2010) | Use IR imaging to study droplet temperature and shape | Infrared thermography of evaporation | Visualization only; no material property extraction | Integrates AI-assisted IR/video analysis to infer material response |
| Wu et al. (2021, Int. J. Heat Mass Transf.) | Study effect of effusivity on Leidenfrost temperature | Effusivity influence in boiling regimes | High-T, non-comparative; complex setup | Operates in safe sub-Leidenfrost regime; applicable at 100–130 °C with common hot plate |
| General evaporation/boiling studies | Understand droplet physics, surface roughness, contact angle | Evaporation rate, wettability | Require specialized setups; not deployable for QC | Low-cost, deployable method for comparative effusivity screening |
| AI-Augmented REC (this work) | Visualize and compare thermal effusivity/conductivity using reference metals | Evaporation time, video analytics, calibrated REC index | ~25–40 % uncertainty; comparative not absolute | First framework linking AI image analysis + reference calibration to visualize conductivity |
Summary Statement
The REC Test is not a repetition of droplet-evaporation research, but a functional reinterpretation:
It turns evaporation time — a transient fluid event — into a referential metric of material heat transfer, anchored by known standards and guided by AI-assisted analysis.
12. Future Collaboration and Call for Experimental Partnership
The Referential Evaporation Comparative (REC) Test marks only the beginning. The next step is to translate this dialogue into a global collaborative experiment — where researchers, students, and innovators can perform the same visual test in their own labs and share data to build an open effusivity–conductivity map for metallic and composite materials.
Researchers interested in:
- validating REC results using MTPS/TPS/LFA instrumentation,
- contributing AI-vision datasets from droplet-evaporation videos, or
- co-authoring educational modules on AI–Human collaborative experimental design,
are warmly invited to connect with the author.


")
")